CiNA Explorer - NAACCR Cancer Statistics
CiNA Explorer Help
CiNA Explorer is an interactive tool for quick access to a wide range of NAACCR cancer statistics organized by cancer site and by demographic characteristics such as sex, race/ethnicity, age, and calendar year. A select number of cancer sites may also be viewed by stage at diagnosis. Statistics may be viewed as graphs or tables and downloaded for use in other programs.
The CiNA Explorer allows for direct comparison of one characteristic at a time (such as Race/Ethnicity or Sex) for selected groups. For example, you can compare Recent Trends of Lung Cancer Incidence by Race/Ethnicity for Women.
Using CiNA Explorer
Quick Start Guide
The following steps provide an overview on how to use the CiNA Explorer application.
- Select a registry using the Get the Started with a Registry dropdown list.
- Select from the list or in the first field of the list begin typing a registry to see the available options that match your term.
- Note: Stage Distribution and Race/Ethnicity data are only available for US Registries.
- Select a cancer site using the Choose a Cancer Site dropdown list.
- Select from the list or in the first field of the list begin typing a cancer site name to see the available sites that match your term.
- Note: Only breast, cervical, colorectal, lung & bronchus, and prostate cancer have Stage Distribution data presented.
- Select a graph type from those available by clicking on the tab.
- Some graphs are line graphs while others are bar graphs depending on which is more appropriate to your selection.
- You can move from the Graph tab to the Data Table tab to see specific numbers.
- The graph and data table will automatically update as you make selections.
- Select a Compare By variable tab.
- The variable tab opens with the primary variable (the Compare By variable) at the top.
- You can select Sex, Race/Ethnicity (U.S. Only), Age, or Registry to compare by.
- Multiple variable values can be selected for the primary variable. For example, when comparing by gender you can select one or more of the choices which are Both Sexes (combined), Female, and Male.
- Age, Sex, Race/Ethnicity (U.S. Only), Stage at Diagnosis (U.S. Only)
- The variables not selected as the variable to Compare By are secondary variables.
- Select values for the secondary variables by clicking on the plus sign to open the dropdown lists and selecting a radio button next to value you want to use.
- The secondary variables can only have one value at a time.
- Select a Graph or a Data Table by clicking on the tab.
- Some graphs are line graphs while others are bar graphs--depending on which is more appropriate for your selection.
- You can move from the Graph tab to the Data Table tab to see specific numbers.
- The graph and data table will automatically update as you make selections.
Interface Details
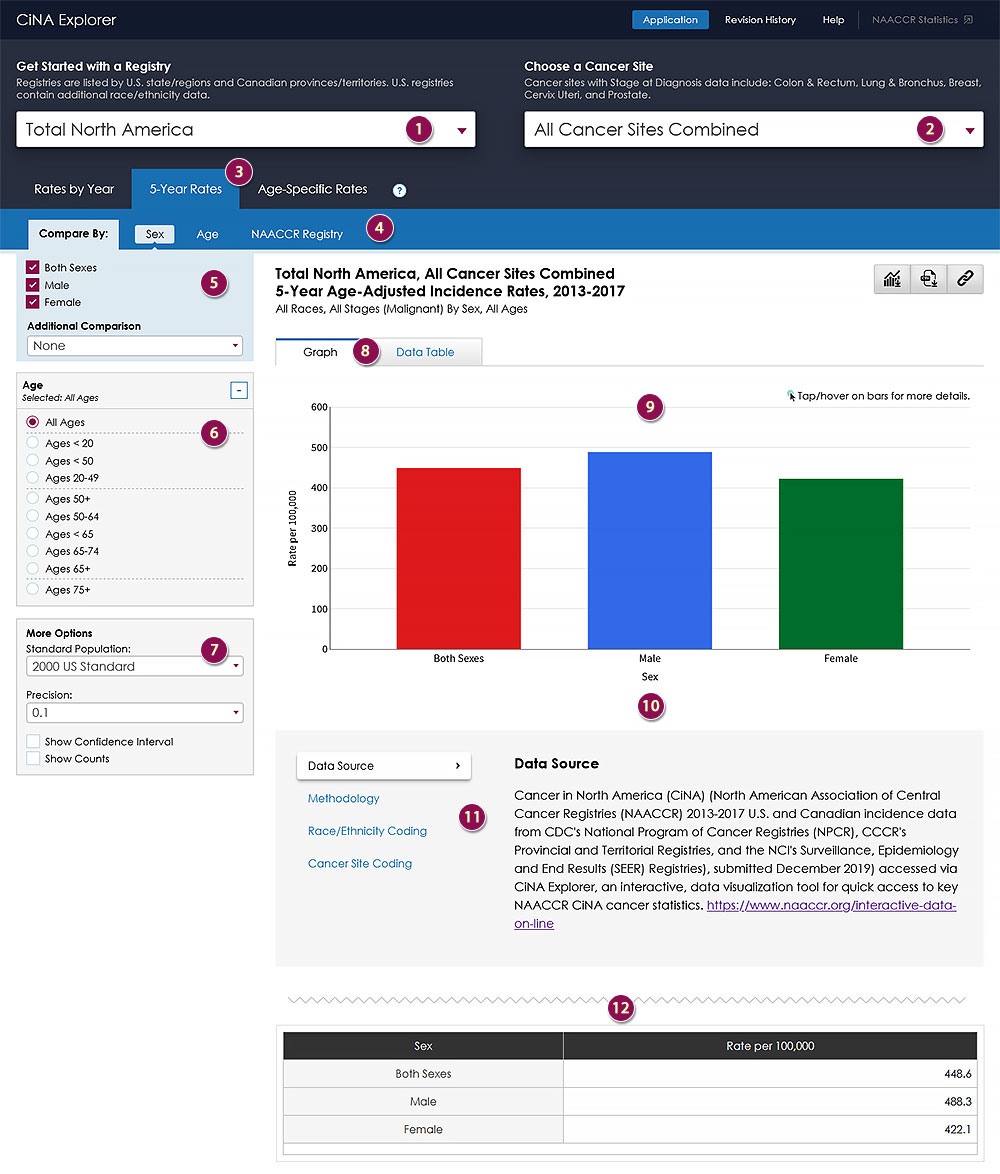
An overview of the CiNA Explorer interface.
User Controls
- Get Started with a Registry
- Choose a Cancer Site
- Graph Type
See definitions by clicking on the question mark. - Compare By tabs
- Compare By variable values
Select more than one value to have a comparison. - Secondary variables
Select only one value from each variable. - More Options – See More Options section for details.
Results
- Selection Tabs
- Graph
- Legend
- Foot Notes
- Data Table
The data table may have choices. If so, you can change your selection using the radio buttons.
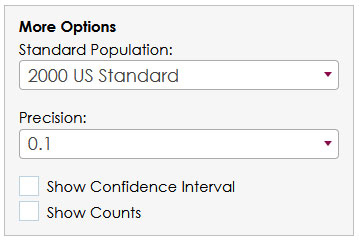
More Options
The controls available under More Options are dependent on the statistic. All of the possible controls that can appear in More Options:
- Precision – The number of decimal places shown in the table for Annual Percent Change (APC) or Rates may be specified here. You can set the value to 0.1, 0.01, 0.001, or 0.0001.
- Show Confidence Interval – When this option is checked, the confidence intervals (CI) will be displayed in the data tables as columns for C.I. Low and C.I. High. The values will also be displayed if you hover over a data point on the graph.
- Show Counts – When this option is checked, the average annual count will be displayed in the data tables as columns. The values will also be displayed if you hover a data point on the graph.
Available Statistics
CiNA Incidence
CiNA Incidence is the number of new cases of the specific cancer site/type per 100,000 people. Number of new cases per number of people in a population are also referred to as incidence rates.
-
Trends
Trends present the delay-adjusted observed (points) and predicted (lines) annual age-adjusted rates and corresponding annual percent change (APC) trend for each joinpoint segment in the table.
-
Rates by Year
Rates by year present the annual age-adjusted rates for the five most recent years of the available data.
-
5-Year Rates
5-year rates present the age-adjusted rate for the aggregated five most recent years of the available data, in a bar chart format. These data match our corresponding CiNA Monograph data.
-
Age-Specific Rates
Age-specific rates refer to a rate for a specified age group for the most recent 5-year time period. NAACCR provides data for 20 separate age groups.
-
Stage Distribution
Stage distributions show the distribution of incidence cases by stage at diagnosis (Localized, Regional, Distant, or Unstaged).
Stage distribution estimates are only available for U.S. registries and the following cancer sites: Breast, Cervix Uteri, Colon & Rectum, Lung & Bronchus, and Prostate.
CiNA Incidence for Pediatric Cancers
CiNA Incidence rates for pediatric cancer diagnoses are available in this application as the number of new cases of the specific cancer site/type per 1,000,000 people. The age at diagnosis range for these rates are ages 0-39. The cancer sites are available in the 'Choose a Cancer Site' dropdown list, below the standard site recode groups.
-
5-Year Rates
5-year rates present the age-adjusted rate for the aggregated five most recent years of the available data, in a bar chart format.
U.S. Mortality
Mortality is the number of new deaths of the specific cancer site/type per 100,000 people. Number of new deaths per number of people in a population are also referred to as mortality rates.
-
Rates by Year
Rates by year present the annual age-adjusted rates for the five most recent years of the available data.
-
5-Year Rates
5-year rates present the age-adjusted rate for the aggregated five most recent years of the available data, in a bar chart format.
-
Age-Specific Rates
Age-specific rates refer to a rate for a specified age group for the most recent 5-year time period. NAACCR provides data for 20 separate age groups.
Survival
Relative survival is an estimate of the percentage of patients who would be expected to survive the effects of their cancer. It excludes the risk of dying from other causes. Relative Survival statistics compare the survival of patients diagnosed with cancer with the survival of people in the general population who are the same age, race, and sex and who have not been diagnosed with cancer.
-
5-year Survival
5-year relative survival shows the estimated percentage of patients who would be expected to survive the effects of their cancer five years or more after cancer diagnosis. It excludes the risk of dying from other. Patients diagnosed over a seven year period are included to allow enough follow-up time for an accurate measure of 5-year survival.
The "All Tumors Matching Selection Criteria" option was used for the multiple primary selection. This option includes all tumors that match the selection criteria. These could include multiple tumors for some individuals; however, only one record per person will contribute to any given survival statistic. However, different tumors for an individual may contribute to multiple statistics. For example, if a person has a breast cancer diagnosed after a lung cancer diagnosis, they are including in both the breast and lung cancer survival rates. However, only the initial lung cancer will be included in All Sites survival statistics.
Relative Survival estimates were age-standardized using the International Cancer Survival Standards (ICSS) and age groups 15-44, 45-54, 55-64, 65-74 and 75+.
There are three ICSS age standards, depending on cancer site:- Standard 1 for sites that have increasing incidence with age.
- Standard 2 for sites that have relatively consistent incidence by age.
- Standard 3 for sites with higher incidence among younger adults.
Prevalence
Cancer Prevalence is the number or percent of people alive on a certain date who have been diagnosed with cancer. In Prevalence we show limited-duration prevalence which represents the proportion of people alive on a certain day who had a diagnosis in the 2, 5, or 10 years prior to the prevalence date. Limited duration prevalence is presented as U.S. counts or percent of the U.S. population by age, sex, race and time since diagnosis.
Registry Groupings
NAACCR Combined Registries
The NAACCR Combined Registry groupings include registries that meet the NAACCR criteria for high quality data definition as described in the corresponding CiNA Monograph.
U.S. Combined, 2003-2022 Trends
Canada Combined, 2003-2022 Trends
U.S. Combined, 2018-2022 Incidence Rates
Canada Combined, 2018-2022 Incidence Rates
U.S. Combined, 2015-2021 Survival and 1/1/2022 Prevalence
Canada Combined, 2015-2021 Survival and 1/1/2022 Prevalence
North America Combined, 2018-2022 Incidence Rates
U.S. Regions
- New England: Connecticut, Maine, Massachusetts, New Hampshire, Rhode Island, Vermont.
- Middle Atlantic: New Jersey, New York, Pennsylvania.
- South Atlantic: Delaware, District of Columbia, Florida, Georgia, Maryland, North Carolina, South Carolina, Virginia, West Virginia.
- East North Central: Illinois, Indiana, Michigan, Ohio, Wisconsin.
- East South Central: Alabama, Kentucky, Mississippi, Tennessee.
- West North Central: Iowa, Kansas, Minnesota, Missouri, Nebraska, North Dakota, South Dakota.
- West South Central: Arkansas, Louisiana, Oklahoma, Texas.
- Mountain: Arizona, Colorado, Idaho, Montana, New Mexico, Utah, Wyoming.
- Pacific: Alaska, California, Hawaii, Nevada, Oregon, Washington.
IHS Purchased/Referred Care Delivery Area (PRCDA) Regions
PRCDA write-up. Text is needed here to explain what PRCDA is. Ideally a link to a webpage that includes a PRCDA 2020 map and also makes sense in the context of what is being shown here.
The regions below list the states included in each region. Only states that have PRCDA counties are listed for the regions.
- Alaska.
- East: Alabama, Connecticut, Florida, Louisiana, Maine, Massachusetts, Mississippi, New York, North Carolina, Pennsylvania, Rhode Island, South Carolina, and Virginia.
- Pacific Coast: California, Idaho, Oregon, and Washington.
- Northern Plains: Indiana, Iowa, Michigan, Minnesota, Montana, Nebraska, North Dakota, South Dakota, Wisconsin, and Wyoming.
- Southern Plains: Kansas, Oklahoma, and Texas.
- Southwest: Arizona, Colorado, Nevada, New Mexico, and Utah.
Standard Populations
Rates are per 100,000 population and are age-adjusted by five-year age groups to the 2000 U.S. standard population based on single years of age (Ries, et al. 2005) and the 2011 Canadian standard population.
Age distributions of the two standard populations
Handling 2020 Incidence Rates in Trends
The joinpoint regression model was not designed to accommodate a 1‐year anomaly in data, as was seen with the 2020 incidence data. The inclusion of such an outlier was shown to influence the location of joinpoints and the value of trend measures and confidence intervals (CIs) and to provide a poor fit of the model such that trends were characterized
inaccurately.
For more details please see:
- Annual Report to the Nation on the Status of Cancer, featuring state-level statistics after the onset of the COVID-19 pandemic
- Mariotto AB, Feuer EJ, Howlader N, Chen HS, Negoita S, Cronin KA. Interpreting cancer incidence trends: challenges due to the COVID-19 pandemic. J Natl Cancer Inst. 2023 Sep 7;115(9):1109-1111. doi: 10.1093/jnci/djad086.https://doi.org/10.1093/jnci/djad086
- National Cancer Institute; Surveillance, Epidemiology, and End Results Program. Impact of COVID-19 on SEER Data Releases.
Definitions
- Age-Adjusted Rate
A method allowing comparisons of populations that takes into account age-distribution differences between populations. - Annual Percent Change
Used to measure trends or the change in rates over time. - APC/Rate Precision
The number of decimal places shown in the data table. - Cancer Sites
Refer to the CiNA Explorer Cancer Site Definitions for more information - Confidence Interval
A range of values that have a specified probability of containing the rate or trend.
- P-Value
Used in the calculation of confidence intervals and in significance testing. The default value for all p-values is 0.05 (equivalent to a 95% confidence interval or 0.05 significance). - Stage at Diagnosis
The stage that the cancer has progressed to at the time of diagnosis.- In Situ: Requires Microscopic Review, Non-invasive
- Localized: Confined to the Primary Site
- Regional: Spread to Regional Lymph Nodes
- Distant: Cancer Has Metastasized
- Unstaged: Unknown (or Not Enough Information to Indicate a Stage)
- Standard Error
The standard error of an estimate is a measure of the sampling variability of the estimate.
Frequently Asked Questions
- How do I do cross-comparisons of multiple characteristics, for example Race and Sex?
In CiNA Explorer, you can only compare one characteristic at a time (chosen on the Compare By box). To do cross comparisons for example, lung cancer incidence rates by Race and Sex, you can download the data in CSV format to be used with external graphic software like Microsoft Excel. - How do I compare multiple registries?
In the current version of CiNA Explorer, you can compare registries by:- Choosing one registry from the Get Started with a Registry dropdown at the top
- In the Compare By section, choose the option NAACCR Registry
- Click or tap the Select Registries button to get a list of all registries
- Choose your registries and select Compare in the window when done
- Where do I go for Technical Support?
Please send questions or comments to CiNA Explorer Support.